


Sorting Data with Charts and Tally Marks Math Worksheets | Paper | Grade 2 Grade 3
Sorting Data with Charts and Tally Marks Math Worksheets | Paper | Grade 2 Grade 3
Couldn't load pickup availability
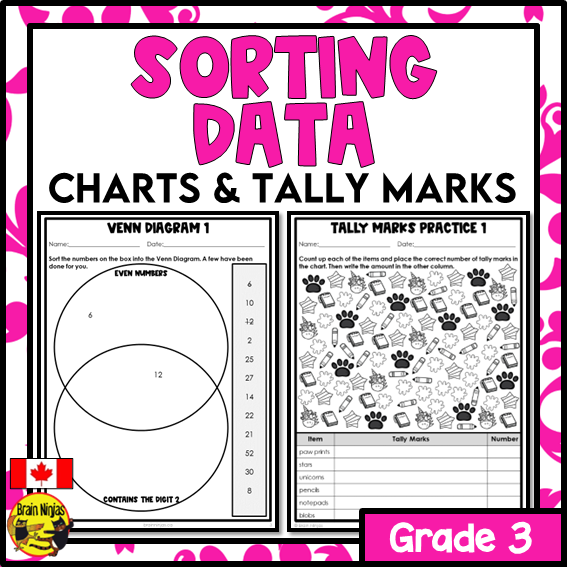
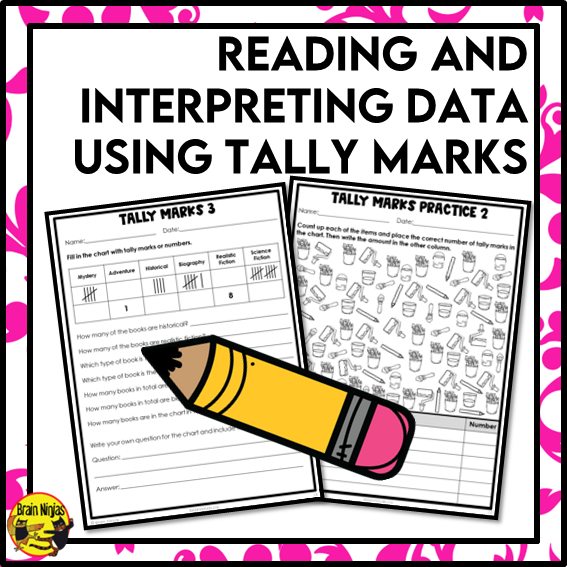
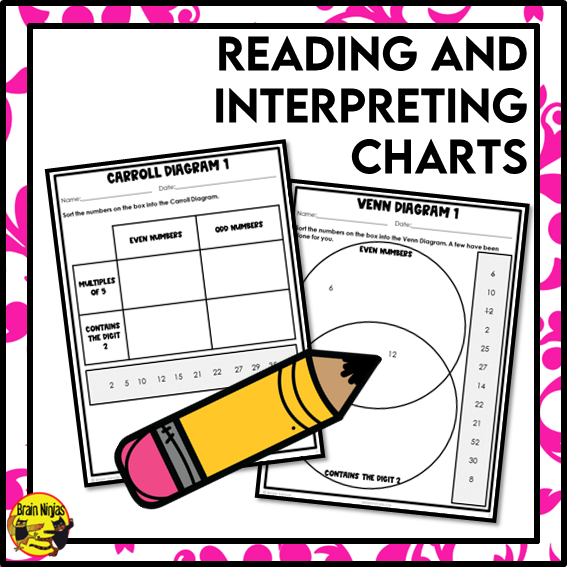
Practice or assess sorting data in Venn and Carroll diagrams or using tally marks to track data with these math worksheets. Use them for practice, review, or assessment. They only take moments to prep and make differentiation a snap.
This resource can be bought in a bundle where you’ll get it at a discount. More information is found below.
This graphing resource includes:
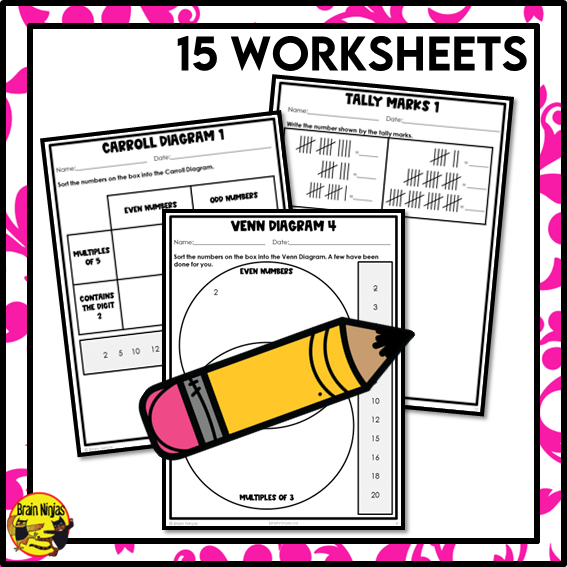
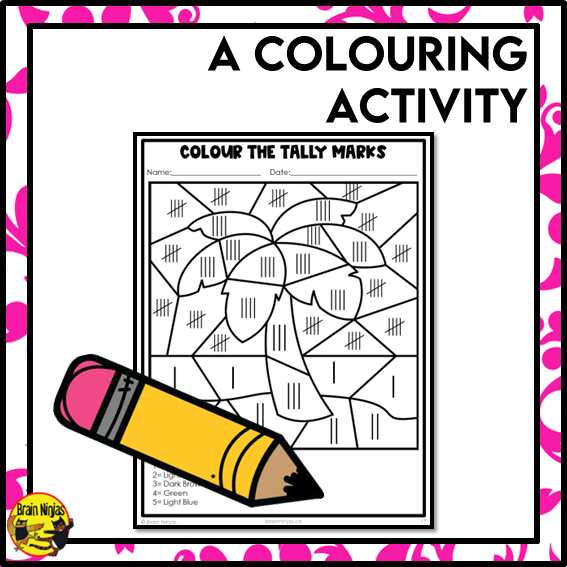
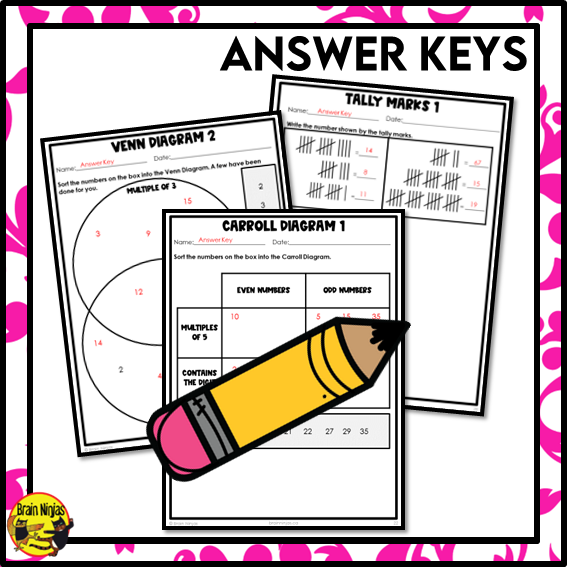
- 15 different pages about sorting data and using tally marks in a variety of ways.
- activities to sort data in Venn Diagrams and Carroll Diagrams.
- one-to-one correspondence for tally marks.
- pages that can easily be used as assessments.
- a colouring page to use for review.
- answer keys or suggested answers for all 15 pages.
- Canadian/British spellings and metric measurements.
- SI Notation, so numbers are written with spaces between place values instead of commas. (Example: 1 000 instead of 1,000).
Ninja Note: This file is a PDF and requires printing for students to use.
This resource aligns with:
-
Alberta Mathematics Curriculum Grade 2 ©2022
- British Columbia Mathematics Curricular Competencies Grade 3
- Saskatchewan Mathematics Curriculum Grade 3 SP3.1
This resource supports:
-
Alberta Mathematics Curriculum Grade 3 ©2022
- any lesson about tally marks.
-
any lesson about sorting data in Venn or Carroll Diagrams.
We use this resource with:
- Statistics and Graphing Interactive Math Unit Grade 3
- Interactive Math Unit Full Year Bundle Grade 3
Where do you teach? We have aligned sets for this topic.
- Alberta Statistics and Graphing Worksheet Bundle Grade 3
- Alberta Full Year Worksheet Bundle Grade 3
- British Columbia Statistics and Probability Worksheet Bundle Grade 3
- British Columbia Full Year Worksheet Bundle Grade 3
- Saskatchewan Statistics and Graphing Worksheet Bundle Grade 3
- Saskatchewan Full Year Worksheet Bundle Grade 3
We also have more general bundles if you teach elsewhere in Canada:
- Math Worksheets Full Year Bundle With Concepts and Holidays Grade 3
- Math Worksheets Full Year Bundle With Concepts Only Grade 3
- Math Worksheets Full Year Bundle With Holidays Only Grade 3
Want to try a free set?
Use our free alignment guide to help figure out which sets work for you.
Have a question? Before contacting us, check our Frequently Asked Questions page.