


Alberta Math Curriculum Statistics and Graphing Worksheets Bundle | Paper | Grade 3
Alberta Math Curriculum Statistics and Graphing Worksheets Bundle | Paper | Grade 3
Couldn't load pickup availability
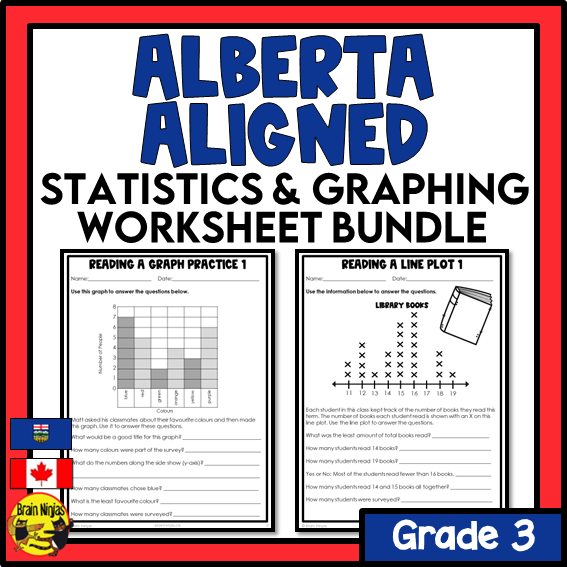
Sort data in charts and create bar graphs and line plots for the new Alberta math curriculum with these worksheets. Use them for practice, review, or assessment. They only take moments to prep and make differentiation easy peasy.
Get the full year worksheet bundle for Grade 3!
This time-saving product includes:
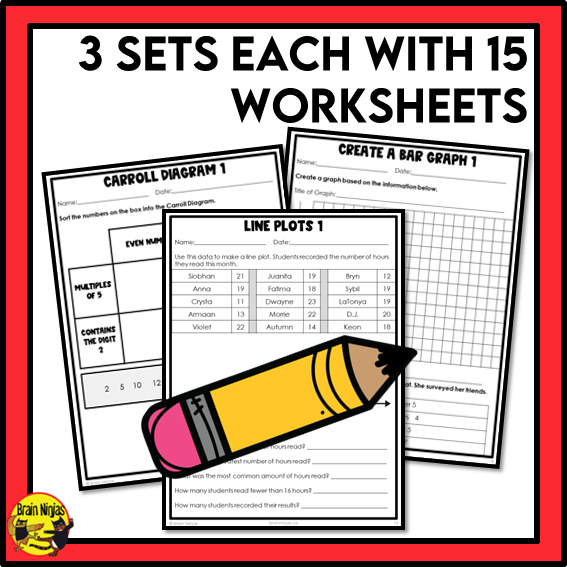
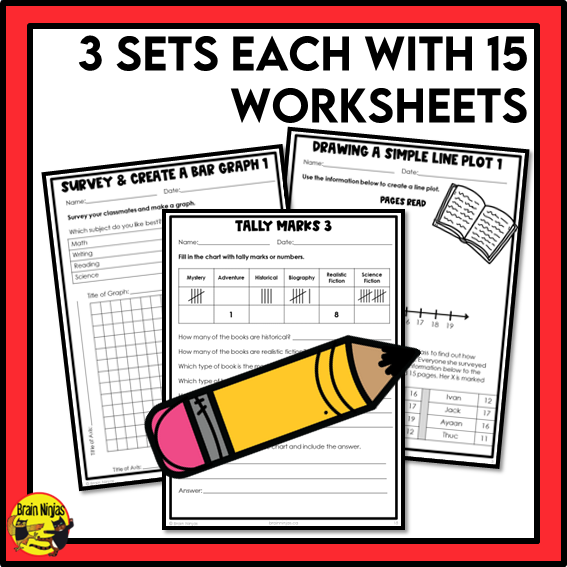
- over 50+ different pages about Grade 3 statistics and graphing concepts.
- pages that can easily be used as assessments.
-
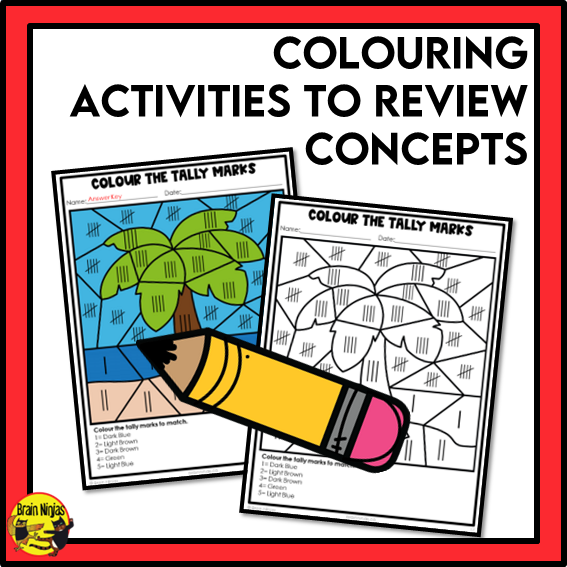
a tally mark colouring page.
-
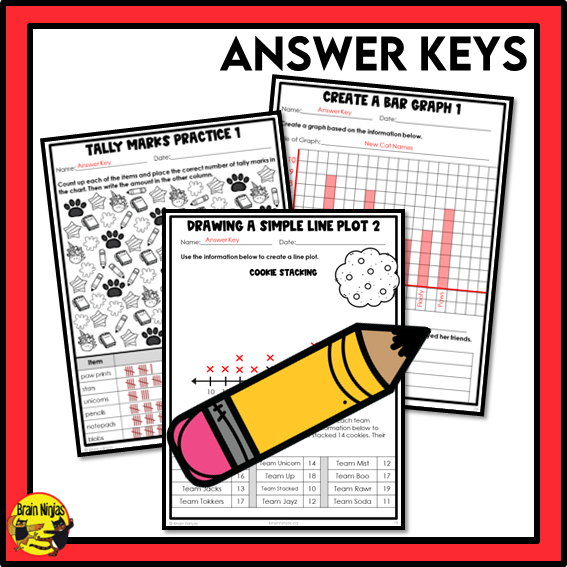
answer keys or suggested answers for all the pages.
- Canadian/British spellings and metric measurements.
- SI Notation, so numbers are written with spaces between place values instead of commas. (Example: 8 000 instead of 8,000).
Topics included are:
- sorting data into Venn Diagrams and Carroll Diagrams
- reading and recording tally marks
- reading, interpreting and creating bar graphs and line plots (also known as dot plots or abstract pictographs).
This set aligns with:
- Alberta Mathematics Curriculum Grade 3 ©2022
This set supports:
- any Canadian Grade 3 math class. See the product descriptions of individual sets for alignment.
Where do you teach?
- Alberta Full Year Worksheet Bundle Grade 3
- British Columbia Full Year Worksheet Bundle Grade 3
- Saskatchewan Full Year Worksheet Bundle Grade 3
We use these worksheets to support lessons in our Interactive Math Units:
Ninja Note: This file is a zip file. It contains all the math worksheet files which are PDFs. These worksheets require printing for students to use.
Not sure if this is the right resource for you? Download our free alignment guide.
Have a question? Before contacting us, check our Frequently Asked Questions page.